
Portfolio management is one of those topics that some product managers never worry about – whilst they might have heard of it, they don’t get involved.
Even those that manage a set of products might treat each as a discrete product and not worry too much about how to share their company’s resources between them.
But it does matter.
Let’s say you have a £10m budget and 10 products, should each be given £1m?
Clearly not, so how do you decide which product gets what?
Having a defined, systematic process for deciding where a company is going to make investments helps avoid wasting resources through a scattergun approach and helps limit the time wasted on knee-jerk reactions to short-term demands.
If you’re a product manager, looking after a single product then it matters to you because it impacts on the resources you’re going to get to spend on improving your product.
If you manage a portfolio then it provides a mechanism for you to make or to recommend investment decisions with your senior management team.
Standard tools
If you’re new to portfolio planning, then it can be tough knowing where to start.
But there are many tools that can help you think through what matters, give you clues about the investment that might be needed and to know where to focus your efforts. They also help you communicate your thinking and decisions to senior leaders in the business.
Product Lifecycles
We recently ran a webinar on lifecycles and have a new infographic that talks about decisions and areas of focus at different points in the lifecycle.
There’s a generic view of what matters at each point in the lifecycle. It’s worth understanding this even though your product and context may not be the same.
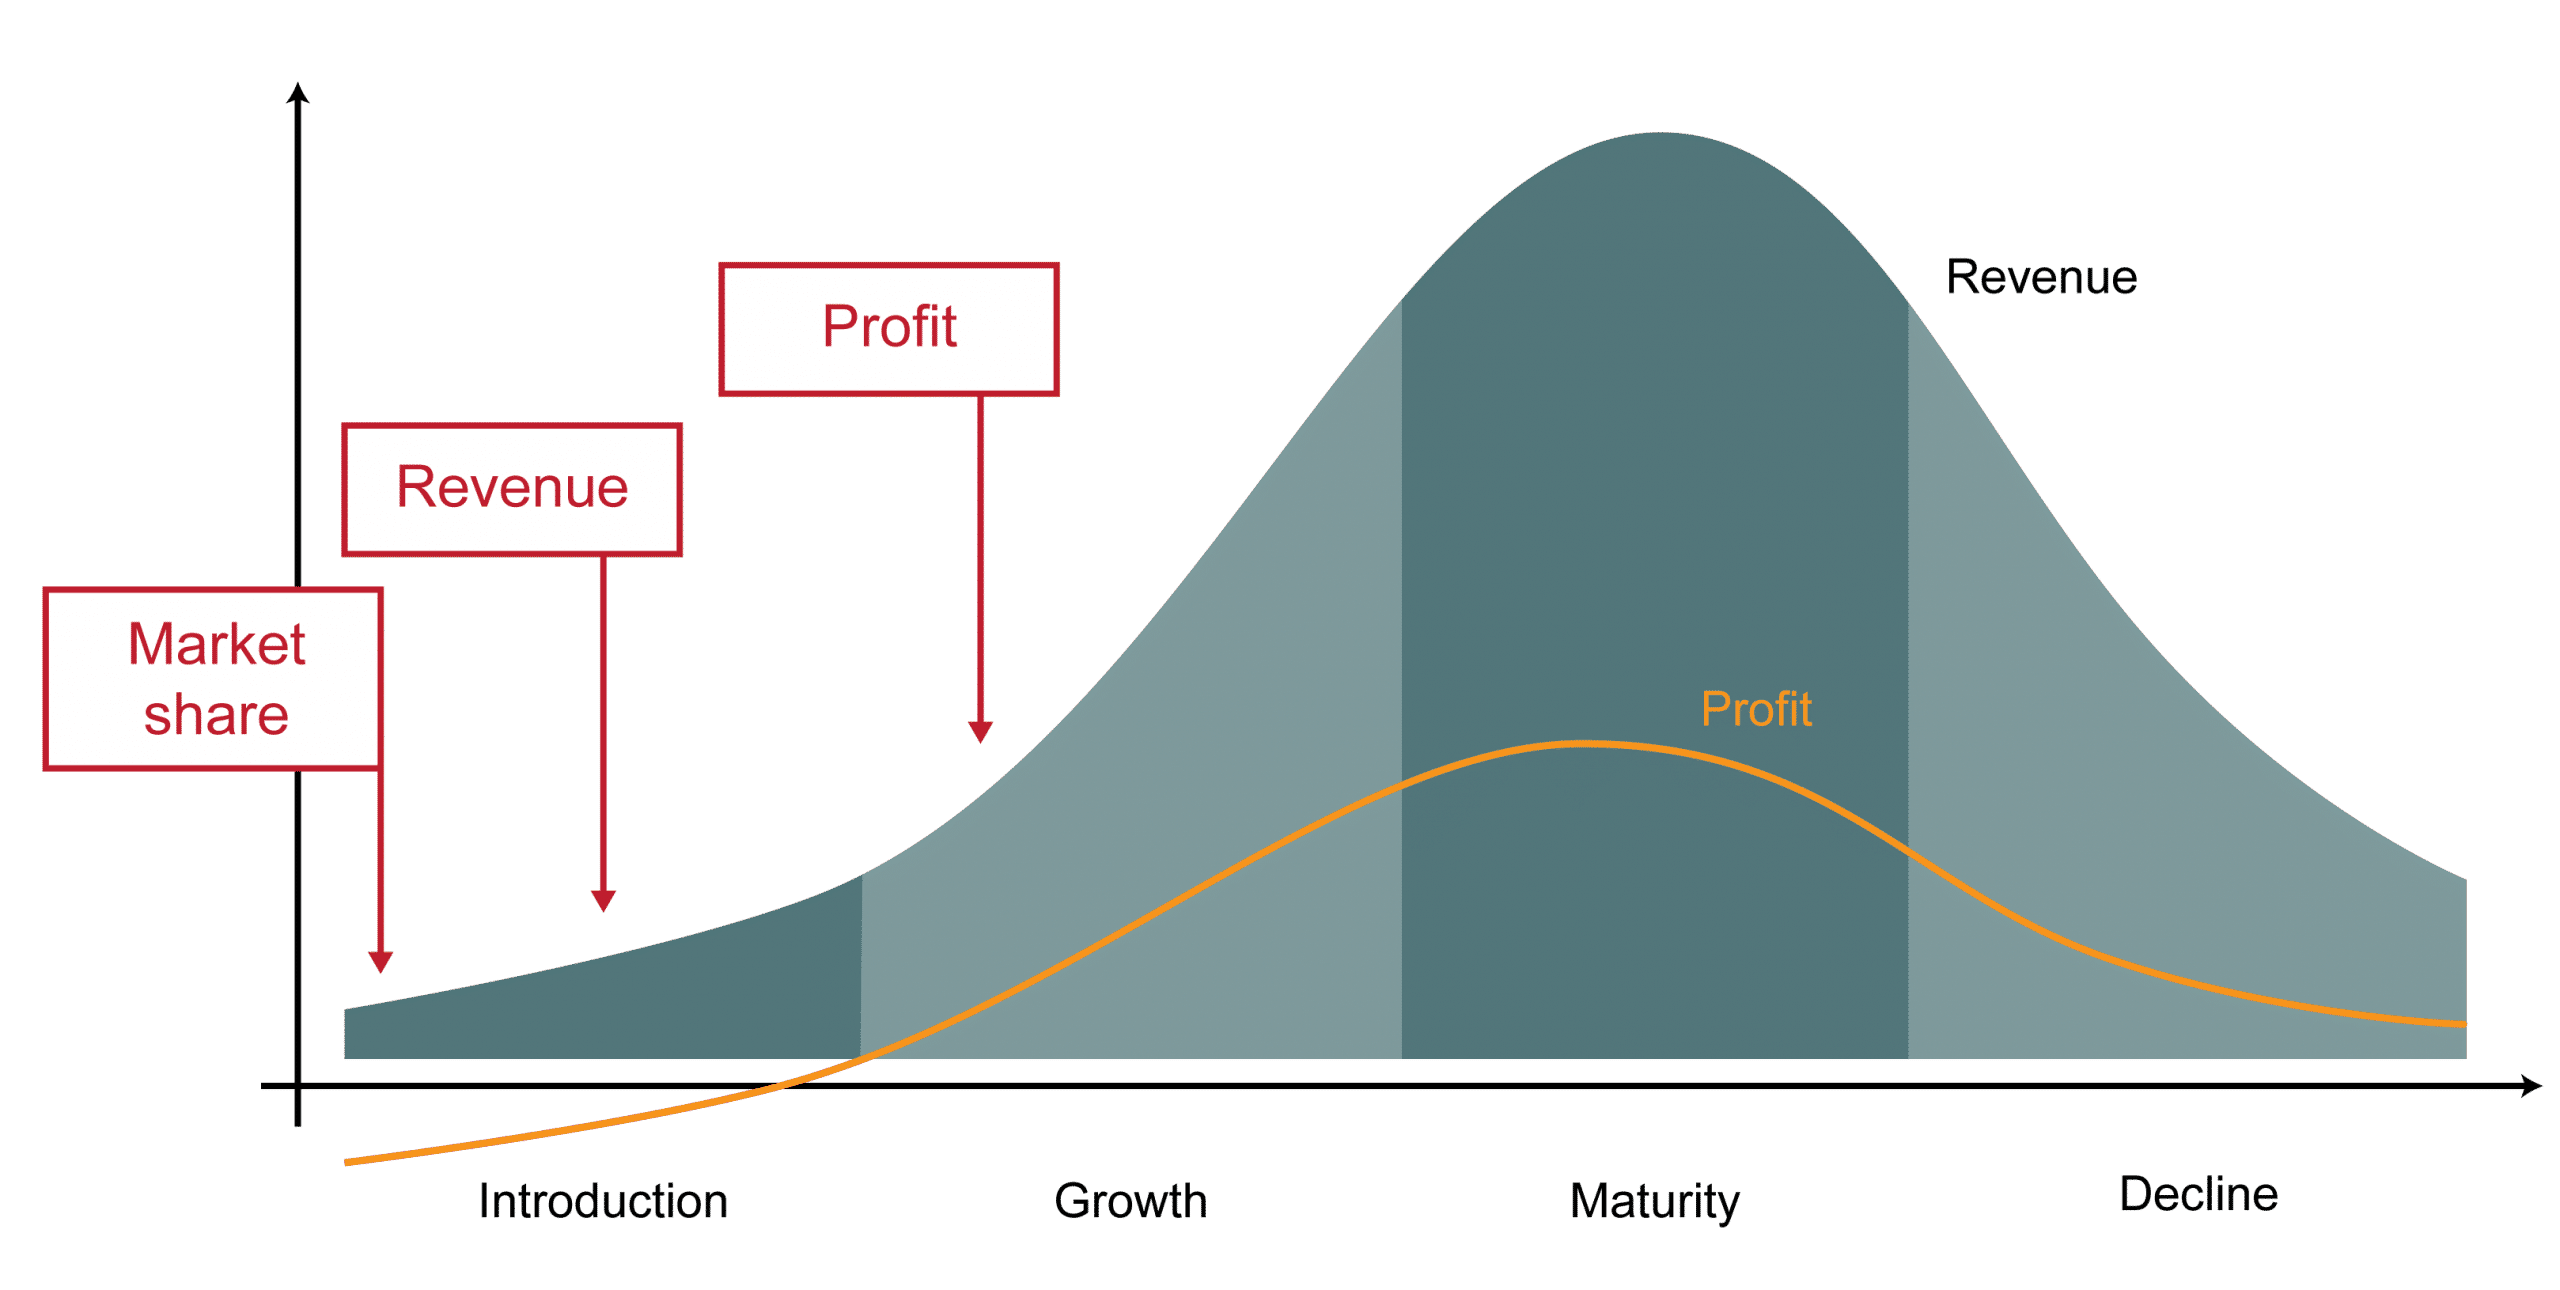
Targets commonly change during the lifecycle
The red text on the graph points to possible business objectives at different stages of the product lifecycle. In the earliest stages of product introduction, market penetration and market share growth are usually key. There’s evidence that establishing a market leadership position in your target niche helps deliver higher profits as you are achieving benefits from scale and higher pricing.
As a product moves out of early introduction, the focus might shift to a different metric of value. For a commercial business, this is likely to be revenue as you seek to monetize your customers. For internal product managers or those who work in a not-for-profit or open-source businesses, other measures of business value would be used (e.g. number of users, number of clients, impact on the brand, pull-through of other products…)
And finally, commercially oriented businesses will, at some point, shift the focus to profits – maximizing the value of the product by changing pricing or costs or some combination of the two.
There is a balance to be made in the portfolio. Early growth is expensive, with high investment in the product, and it’s only usually as things ramp into steady growth that there’s payback from the initial investment. When you think as a portfolio manager, you’ll need to balance the needs for investment in early-stage products with the profits that come from products that are more mature.
Horizons
Another point of balance is between long term bets and in-life products. A useful model to help visualize and communicate this is 3 horizons from McKinsey.
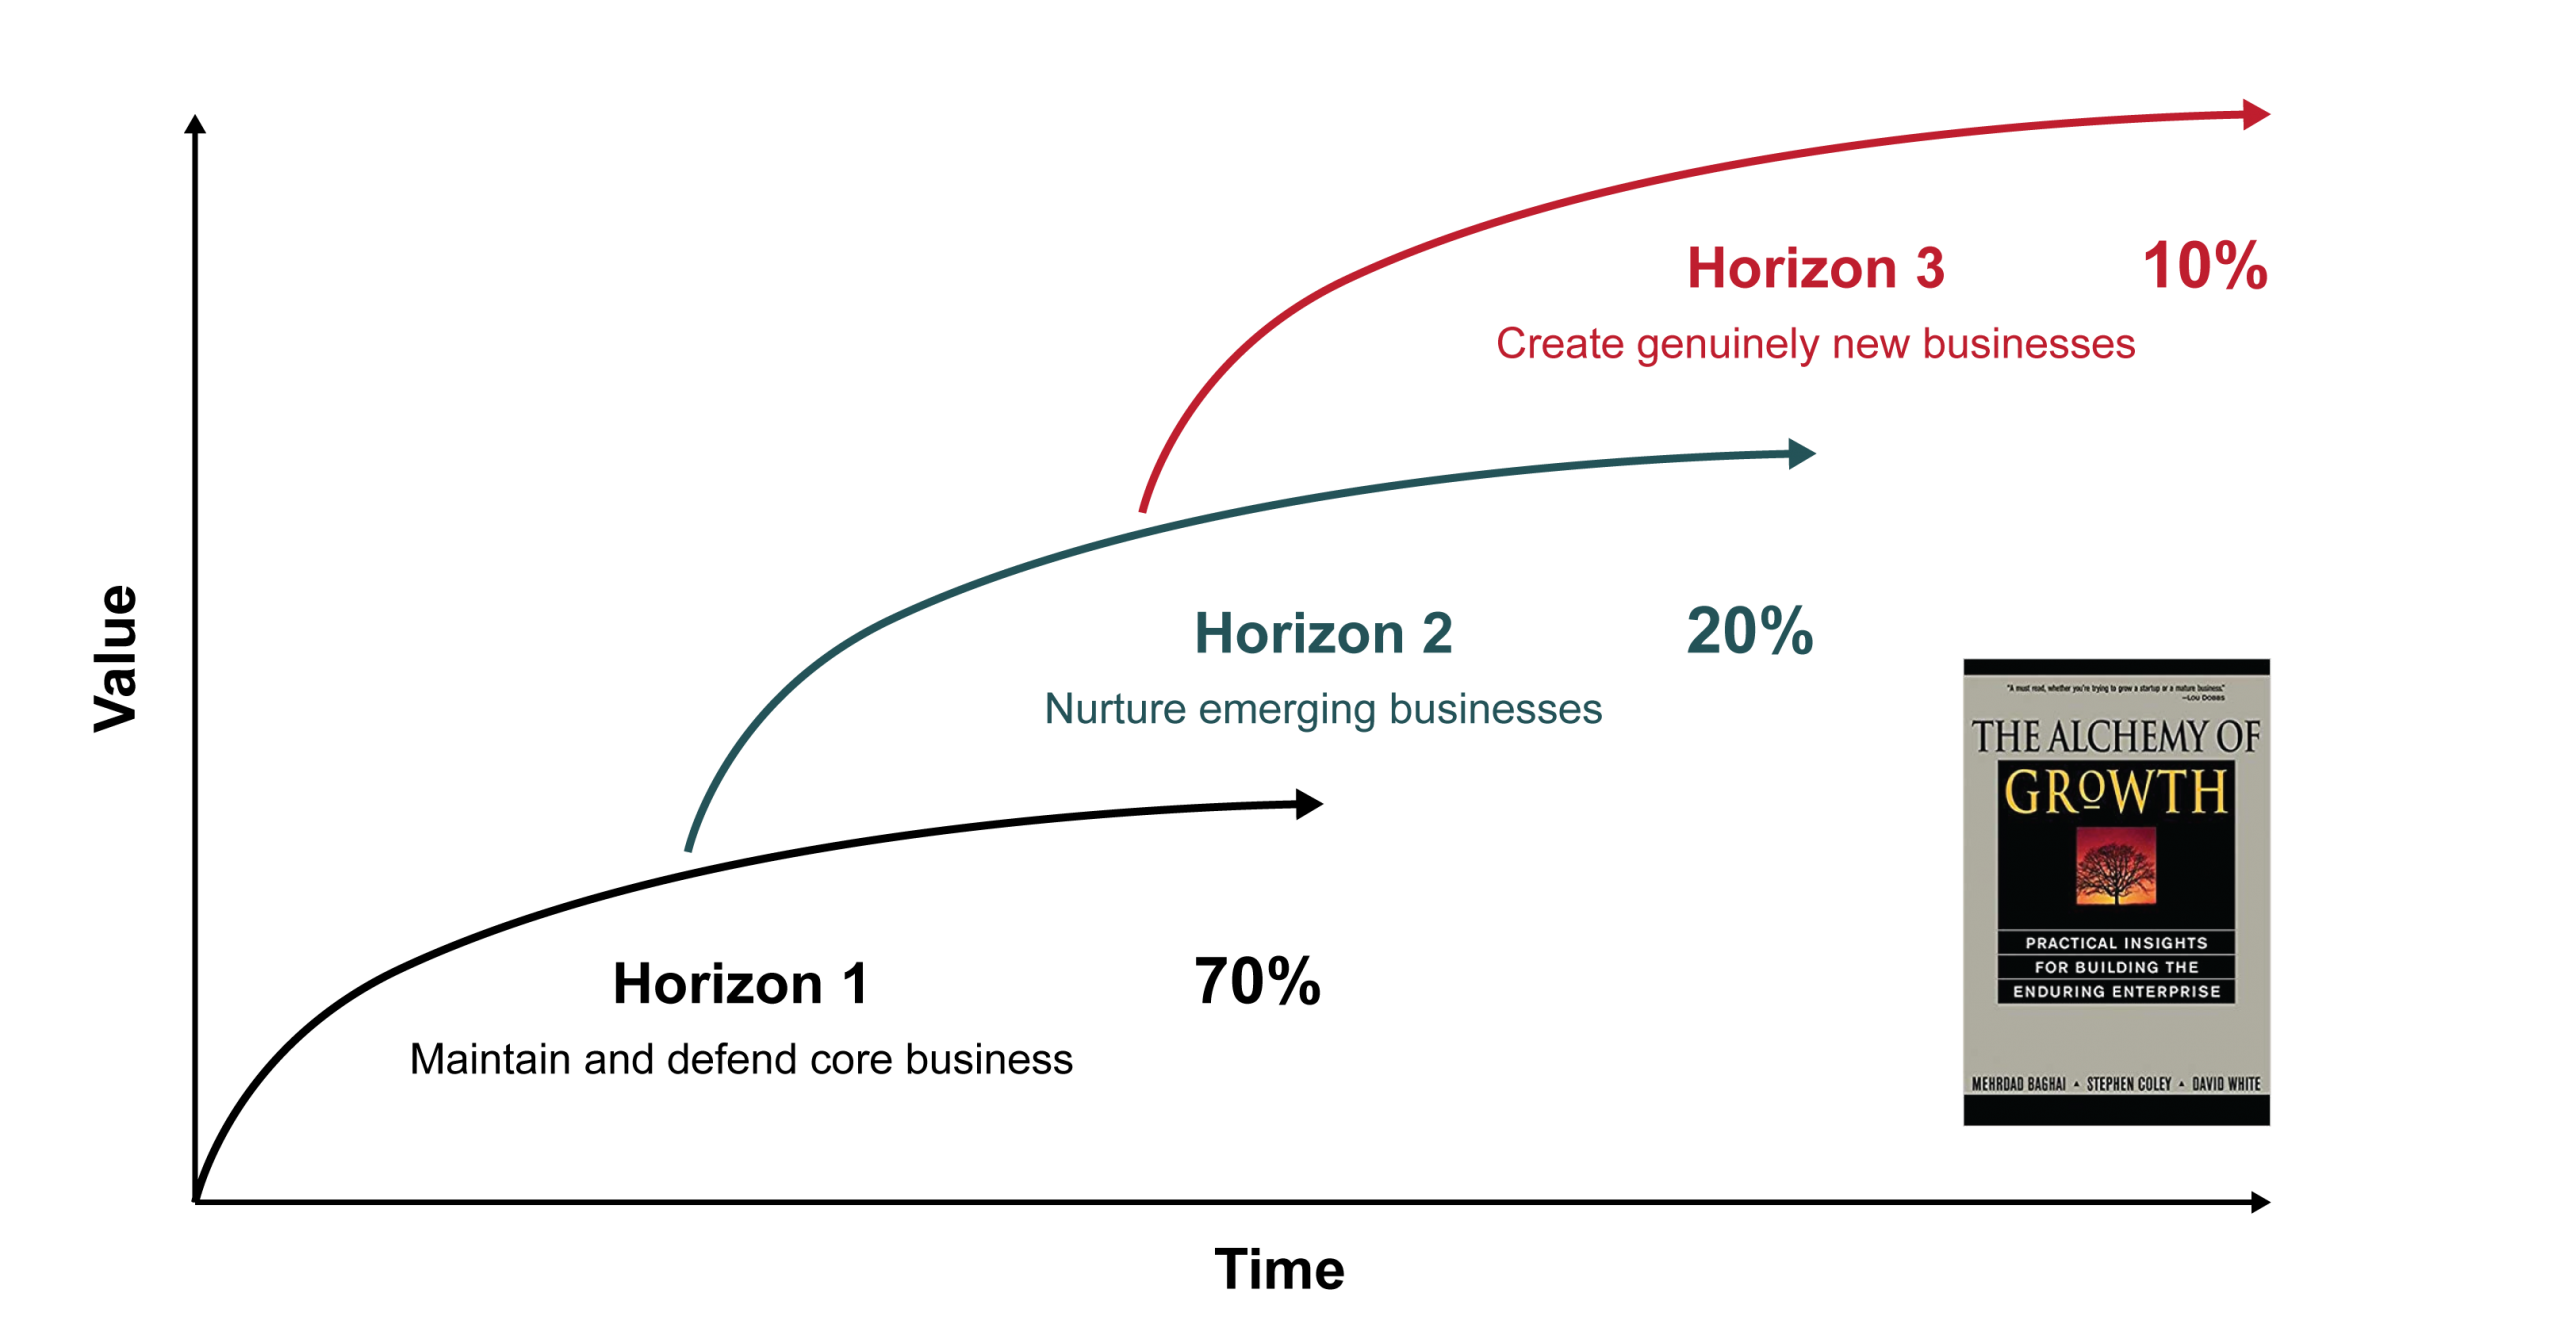
Balance investment in today’s products with plans for the mid and longer-term
In the McKinsey model, as companies mature, they often face declining growth as innovation gives way to inertia. In order to achieve consistent levels of growth throughout their corporate lifetimes, companies must work on existing businesses while still considering areas they can grow in the future.
Horizon 1 is about maintaining and defending the core business (around 70% of investment goes here)
Horizon 2 is about nurturing emerging business (around 20% of investment goes here)
Horizon 3 is about creating genuinely new business – these are your moonshots (around 10% of investment goes here)
This model can be applied at both a strategic level but can also be used at a product level, e.g. as a roadmap approach with Horizon 1 becoming “Now”, Horizon 2 “Next” and Horizon 3 “Future”.
The timescales of each horizon can vary considerably. In some companies we’ve worked in, Horizon 1 looks out a year or less, horizon 2 goes out up to 3 years whereas in others Horizon 1 looks forward 3-5 years and Horizon 2 looks out 7-10 years. It all depends on their context – are they in a new industry, a fast-moving industry or something that’s more stable and mature?
The reality of investment is also often different from the McKinsey model. In some businesses with whom we’ve worked, innovation investment (horizon 2 and 3) is in the single digits.
There’s a reason this happens.
When an organization becomes successful at something, they tend to do more of it. That means they shift from what happened in their earliest days when they experimented and explored product and market opportunities to focusing more resources on things they know will work. It’s easy to get internal approval to exploit what is working well because it’s low-risk high-reward.
In some cases, the organization stagnates and dies because more innovative, disruptive businesses come and take the market away from them.
In other businesses, there’s often a wake-up call for the senior management as they recognize the lack of innovation and the pendulum of investment swings wildly from the short term to the long term. Then, some months later, existing customers start complaining and the pendulum swings back again to sort out in-life problems… and then the lack of forward planning gets recognized once more…and so the pendulum continues to cycle between the long and short term and back again. It’s not a great experience for those people working in these businesses!
Ideally, you’ll want to agree on a balance of investment for in-life products and their roadmap and longer-term initiatives.
Focused investment
So far, we’ve thought about positions in the lifecycle and balancing investment between in-life and future ideas.
These are useful perspectives but there’s really a need to consider the strengths of our business and our alignment with attractive markets.
That’s where another tool, the McKinsey / General Electric Matrix comes into play.
You can use this to map your portfolio of products to see which play to your company’s strengths and which are playing in attractive markets.
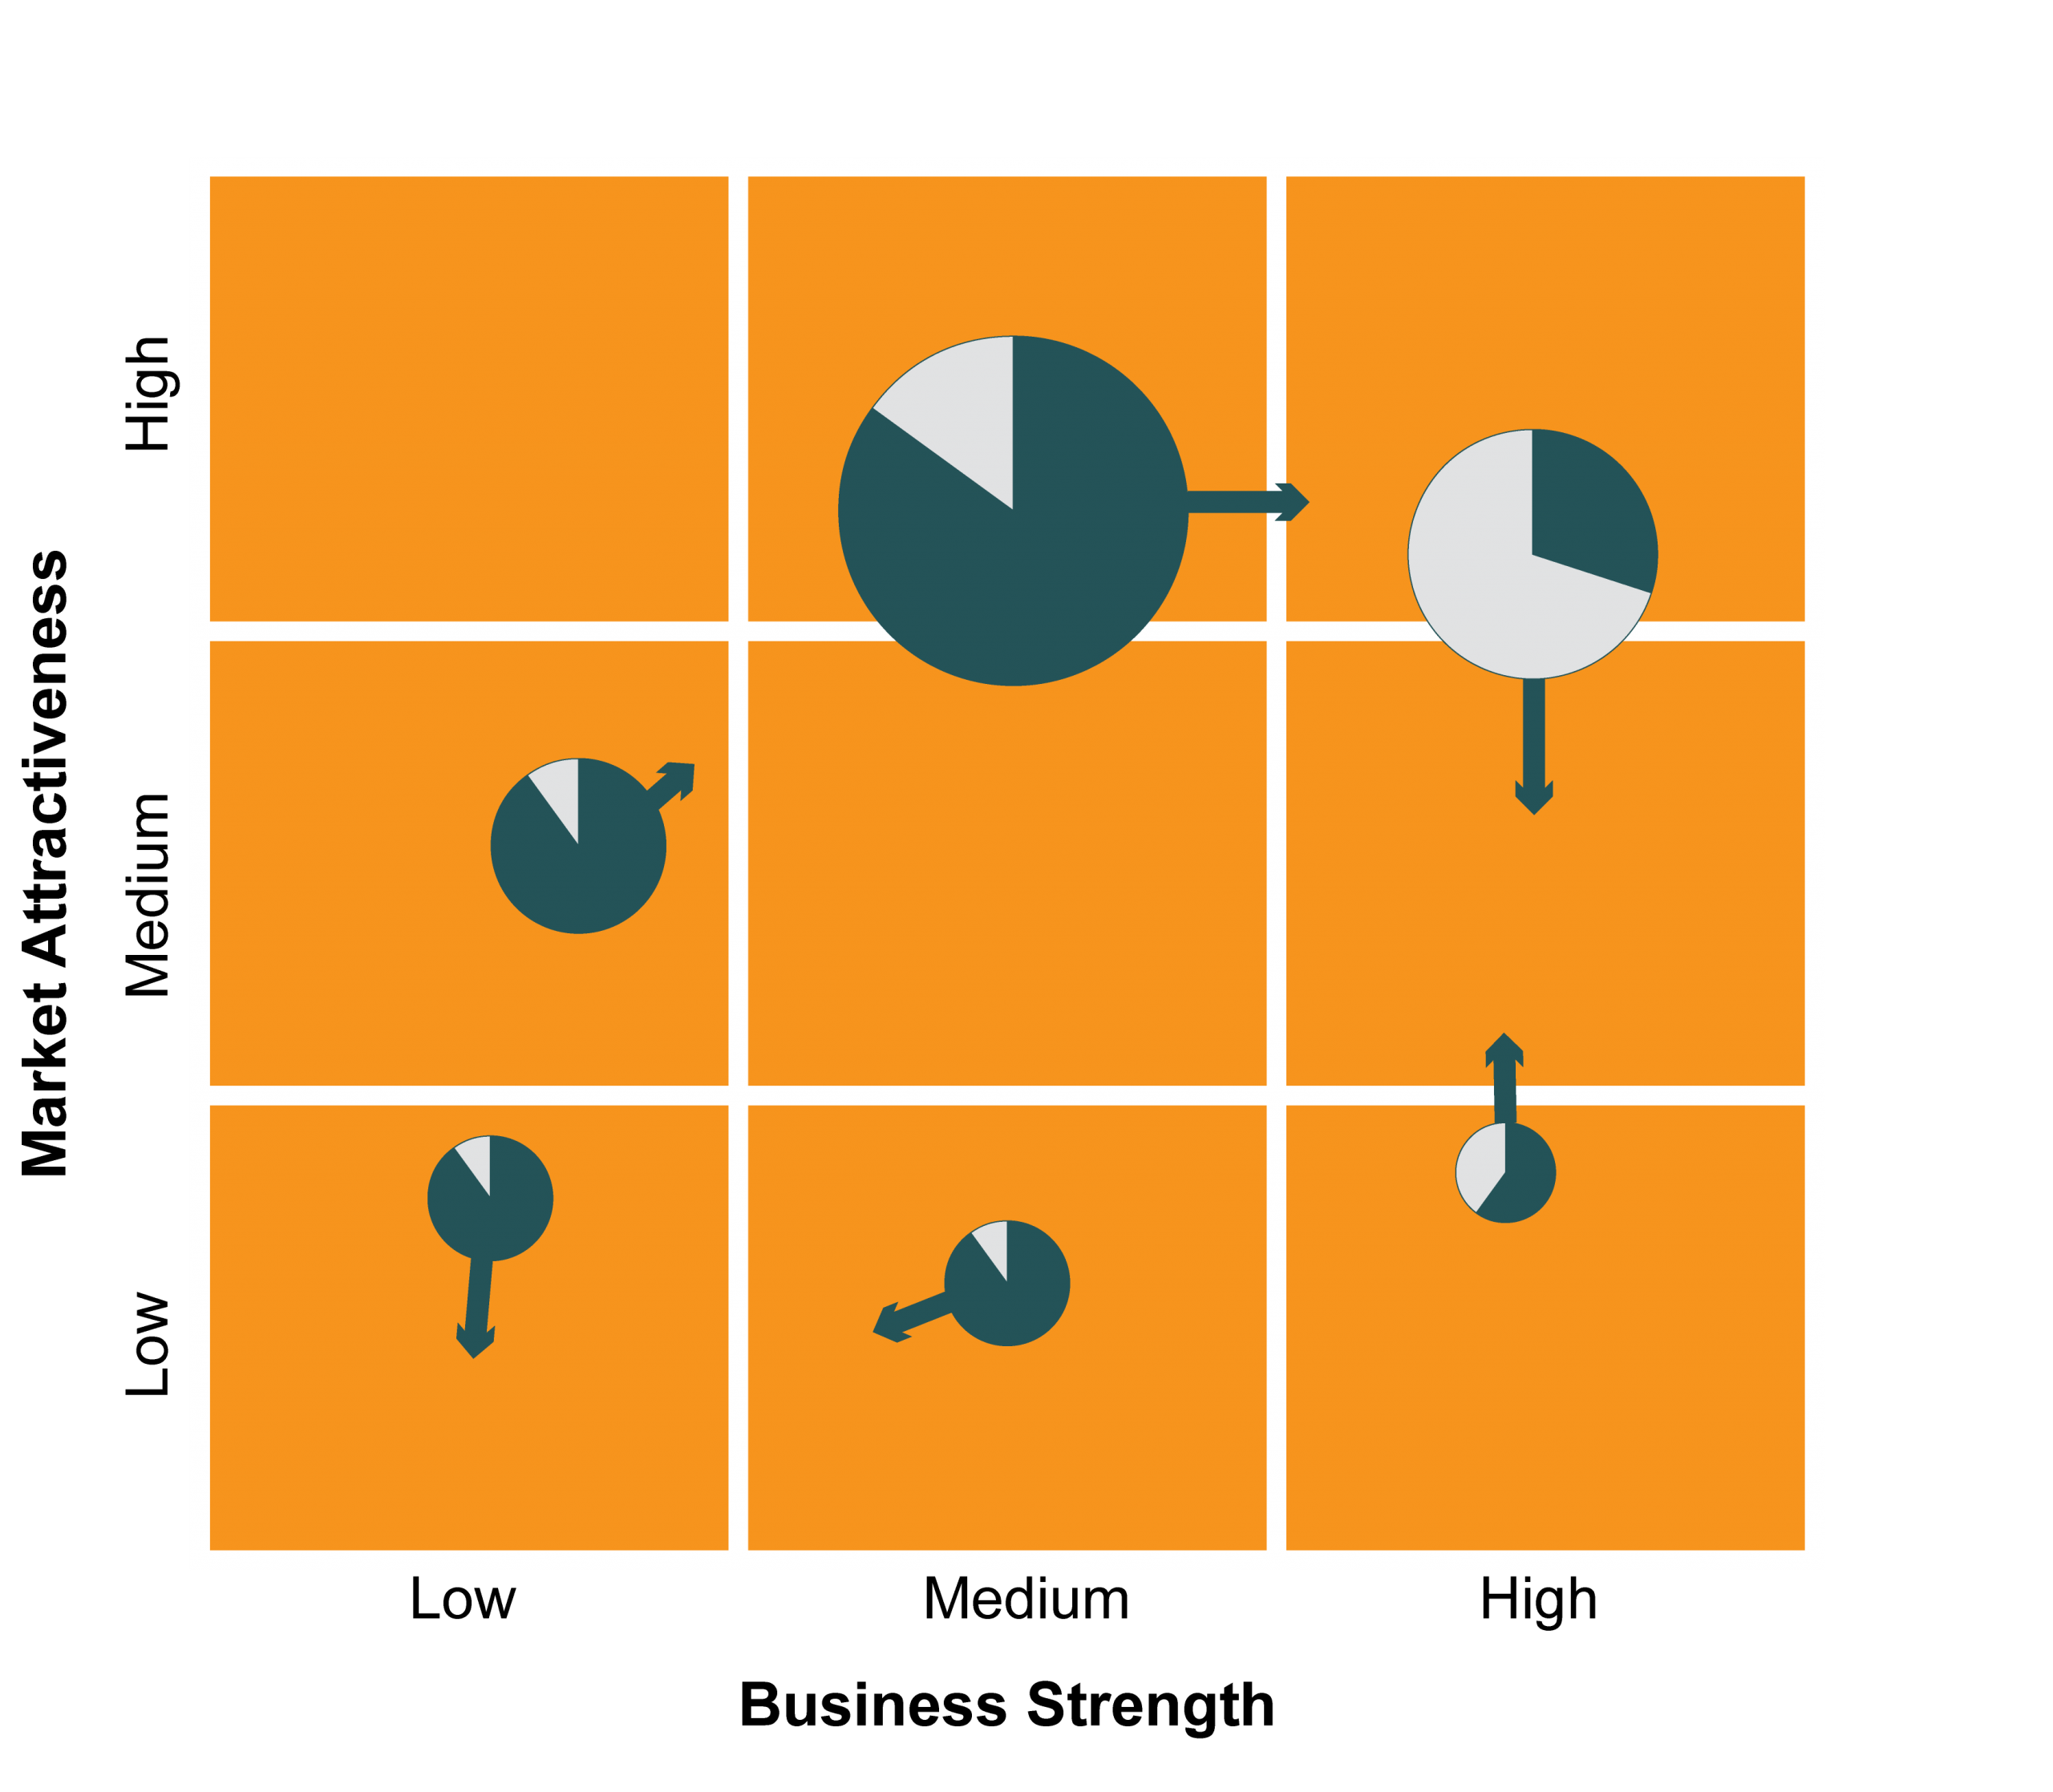
Plot your products on the GE Matrix to visualize how things really are
Each blob on this graph represents a product. The size of the bubble shows the revenue (or could be used to show the profit) and the slice of the pie shows market share. The arrow shows our current forecast for how things are changing.
Where things aren’t quite right, the matrix gives guidance on where to focus.
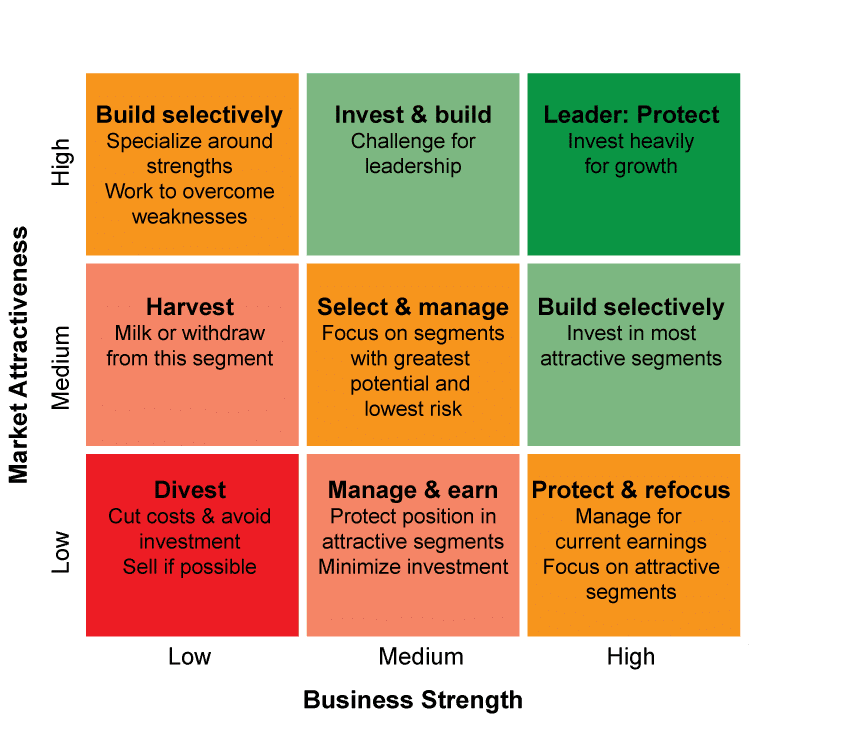
Align your plans with the potential and challenges of each product.
You can use this to help facilitate your internal discussions. For example, if we’re in the central box at the bottom, Manage & Earn, you’ll probably want to spend time identifying attractive market segments and how sales, marketing, and development efforts can be focused to drive growth in those segments and find similar alternates to target.
If a product is in the Leader: Protect box in the top right, then you’ll probably ramp up your efforts to maximize the return on products.
The measurement of business strength and market attractiveness is not mandated. There are various factors that you might want to consider.
For example, an assessment of business strength might consider current market share, reputation, technology, competencies, quality, cost structure, key assets or other factors.
The assessment of markets might consider size and growth rate, profit potential, competitive intensity or other factors.
Assessing investment risk
The scoring used for the General Electric matrix might consider the risk associated with either the market place or product space. For example, the risk will increase if we’re moving into a completely new market.
However, a better tool to discuss risk is often the Ansoff matrix.
Ansoff has been around for decades but it’s proven to be a really useful model to help think through and to discuss risk.
It has two axes, Products, and Markets.
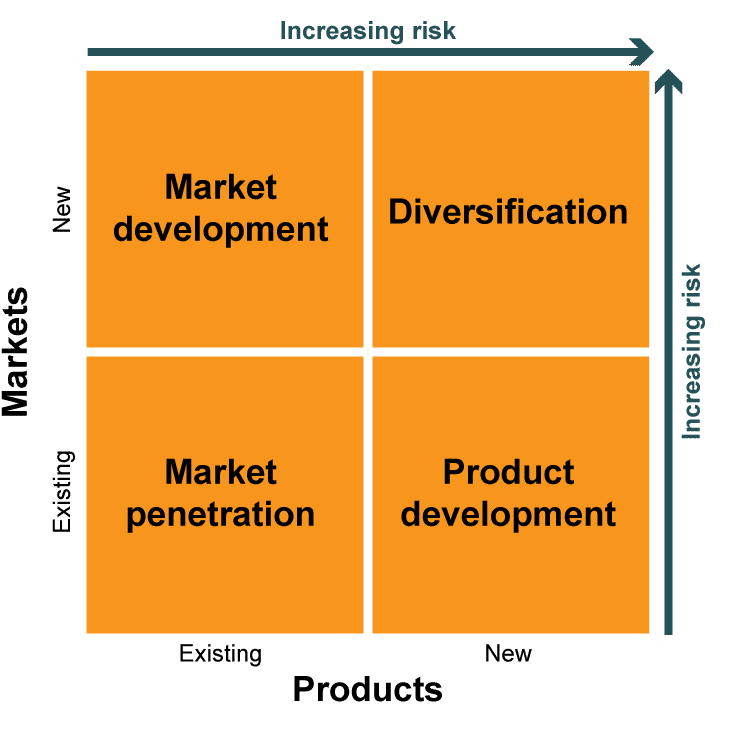
Use the Ansoff matrix to think about risk
To use the tool, plot your ideas onto the matrix: enhancements to existing products in existing markets go in the bottom left; new market opportunities for existing products go in the top left; new product ideas to existing customer segments go in the bottom right whilst new products for new markets go in the top right.
Those in the bottom left are really low risk (but potentially low reward – they’re often simple extensions of existing products) whilst those in the top right are very high risk (but with potentially high reward – for example, by entering a rapidly growing market with high-profit potential).
One example to illustrate the value of Ansoff came from a client of ours. They had been phenomenally successful with near 100% penetration of their home market. They took the same products to remote markets and failed badly. They didn’t recognize the risks inherent in moving to a different market and so they failed to invest in the market research needed to understand the market differences and adapt their product and marketing to ensure these were addressed. A rapid recall and a more thoughtful approach have seen them get back on track for success.
Putting it together
Portfolio planning is not something that most of us do every day. But, as a business, including it as part of six-monthly reviews or annual planning helps keep a focus on what’s important.
To get a robust, realistic view of the potential from products and innovative ideas there are a few things that need to be put in place.
- Agreement on the tools that will be used (e.g. 3 horizons and GE Matrix).
- Establishing a systematic process (with sufficient time) to gather input from senior leaders and from the product team helps create a set of initial recommendations for investment.
- Including a peer review of the assumptions and drivers for growth to get a consistent view of the market.
Whether you’re a product manager or team leader, taking part in the process is a great opportunity to get senior buy-in to your ideas.
And an opportunity to show that you know what you’re talking about!
Andrew Dickenson
Product Focus Director


Leave a comment